LTC1412IG Ver la hoja de datos (PDF) - Linear Technology
Número de pieza
componentes Descripción
Lista de partido
LTC1412IG Datasheet PDF : 16 Pages
| |||
LTC1412
APPLICATIONS INFORMATION
12
74
68
10
62
56
8
6
4
2
0
1k
10k
100k
1M
10M
INPUT FREQUENCY (Hz)
1412 G01
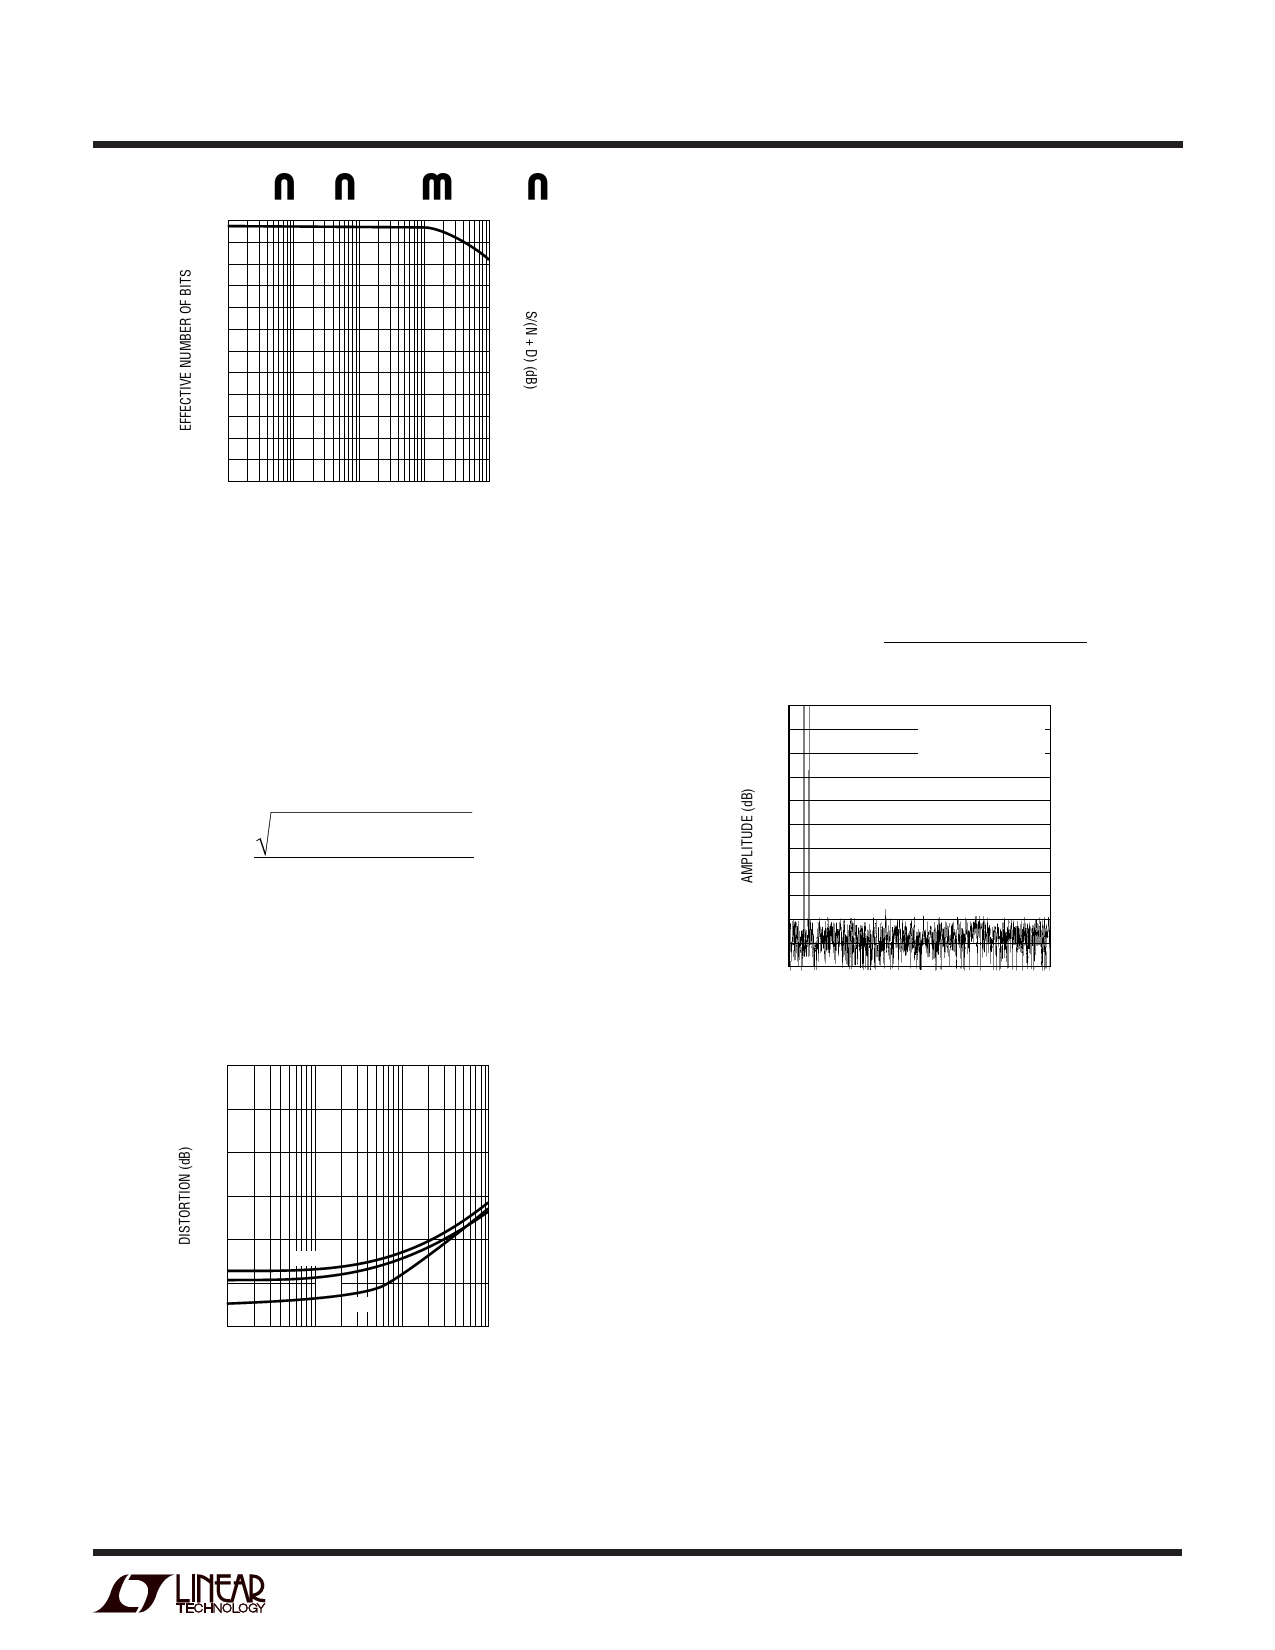
Figure 3. Effective Bits and Signal/(Noise + Distortion)
vs Input Frequency
Total Harmonic Distortion
Total Harmonic Distortion (THD) is the ratio of the RMS
sum of all harmonics of the input signal to the fundamental
itself. The out-of-band harmonics alias into the frequency
band between DC and half the sampling frequency. THD is
expressed as:
THD = 20 log V22 + V32 + V42 + . . .Vn2
V1
where V1 is the RMS amplitude of the fundamental fre-
quency and V2 through Vn are the amplitudes of the
second through Nth harmonics. THD vs input frequency is
shown in Figure 4. The LTC1412 has good distortion
performance up to the Nyquist frequency and beyond.
0
– 20
– 40
– 60
– 80
THD
– 100
3RD
2ND
– 120
10
100
1k
10k
INPUT FREQUENCY (Hz)
1412 G03
Figure 4. Distortion vs Input Frequency
Intermodulation Distortion
If the ADC input signal consists of more than one spectral
component, the ADC transfer function nonlinearity can
produce intermodulation distortion (IMD) in addition to
THD. IMD is the change in one sinusoidal input caused by
the presence of another sinusoidal input at a different
frequency.
If two pure sine waves of frequencies fa and fb are applied
to the ADC input, nonlinearities in the ADC transfer func-
tion can create distortion products at the sum and differ-
ence frequencies of mfa ±nfb, where m and n = 0, 1, 2, 3,
etc. For example, the 2nd order IMD terms include
(fa + fb). If the two input sine waves are equal in magni-
tude, the value (in decibels) of the 2nd order IMD products
can be expressed by the following formula:
( ) ( ) IMD
fa + fb
Amplitude at
= 20 log
fa ± fb
Amplitude at fa
0
–10
– 20
– 30
– 40
– 50
– 60
– 70
– 80
– 90
– 100
– 110
0
fSMPL = 3MHz
fIN1 = 85.693359kHz
fIN2 = 114.990234kHz
200 400 600 800 1000 1200 1400
FREQUENCY (kHz)
1412 G05
Figure 5. Intermodulation Distortion Plot
Peak Harmonic or Spurious Noise
The peak harmonic or spurious noise is the largest spec-
tral component excluding the input signal and DC. This
value is expressed in decibels relative to the RMS value of
a full-scale input signal.
Full Power and Full Linear Bandwidth
The full power bandwidth is that input frequency at which
the amplitude of the reconstructed fundamental is
reduced by 3dB for a full-scale input signal.
The full linear bandwidth is the input frequency at which
the S/(N + D) has dropped to 68dB (11 effective bits). The
LTC1412 has been designed to optimize input bandwidth,
allowing the ADC to undersample input signals with fre-
9
Share Link: 