FSL116LR Ver la hoja de datos (PDF) - Fairchild Semiconductor
Número de pieza
componentes Descripción
Lista de partido
FSL116LR Datasheet PDF : 13 Pages
| |||
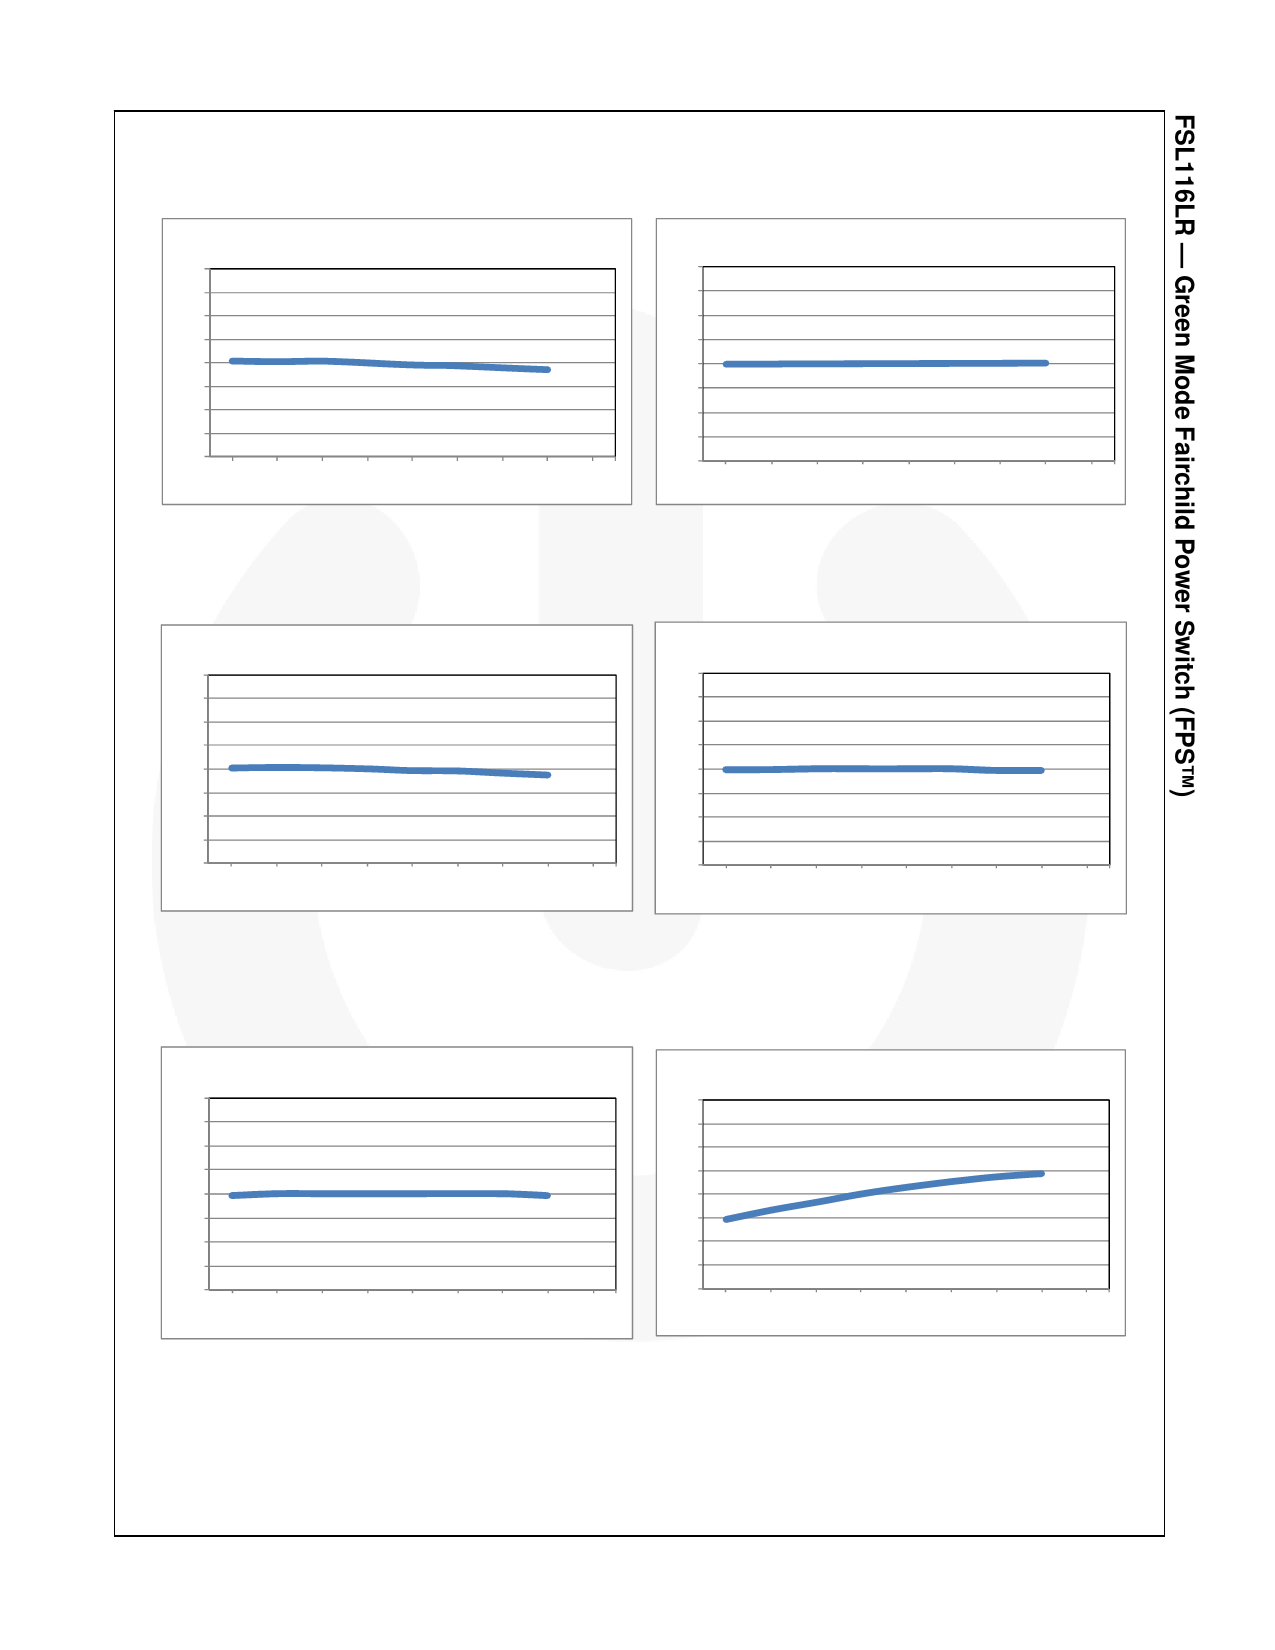
Typical Performance Characteristics
These characteristic graphs are normalized at TA=25.
Operating Frequency (fOSC)
1.4
1.3
1.2
1.1
1
0.9
0.8
0.7
0.6
-40℃ -25℃ 0℃ 25℃ 50℃ 75℃ 100℃ 120℃ 140℃
Figure 4. Operating Frequency
vs. Temperature
Maximum Duty Cycle (DMAX)
1.4
1.3
1.2
1.1
1
0.9
0.8
0.7
0.6
-40℃ -25℃ 0℃ 25℃ 50℃ 75℃ 100℃ 120℃ 140℃
Figure 5. Maximum Duty Cycle
vs. Temperature
Operating Supply Current (Iop2)
1.4
1.3
1.2
1.1
1.0
0.9
0.8
0.7
0.6
-40 -25 0 25 50 75 100 120 140
Figure 6. Operating Supply Current
vs. Temperature
Start Threshold Voltage (VSTART)
1.4
1.3
1.2
1.1
1.0
0.9
0.8
0.7
0.6
-40 -25 0 25 50 75 100 120 140
Figure 7. Start Threshold Voltage
vs. Temperature
Stop Threshold Voltage (VSTOP)
1.4
1.3
1.2
1.1
1.0
0.9
0.8
0.7
0.6
-40 -25 0 25 50 75 100 120 140
Figure 8. Stop Threshold Voltage
vs. Temperature
Feedback Source Current (IFB)
1.4
1.3
1.2
1.1
1
0.9
0.8
0.7
0.6
-40℃ -25℃ 0℃ 25℃ 50℃ 75℃ 100℃ 120℃ 140℃
Figure 9. Feedback Source Current
vs. Temperature
© 2010 Fairchild Semiconductor Corporation
FSL116LR • Rev. 1.0.1
7
www.fairchildsemi.com
Share Link: 