W216 Ver la hoja de datos (PDF) - Cypress Semiconductor
Número de pieza
componentes Descripción
Lista de partido
W216 Datasheet PDF : 14 Pages
| |||
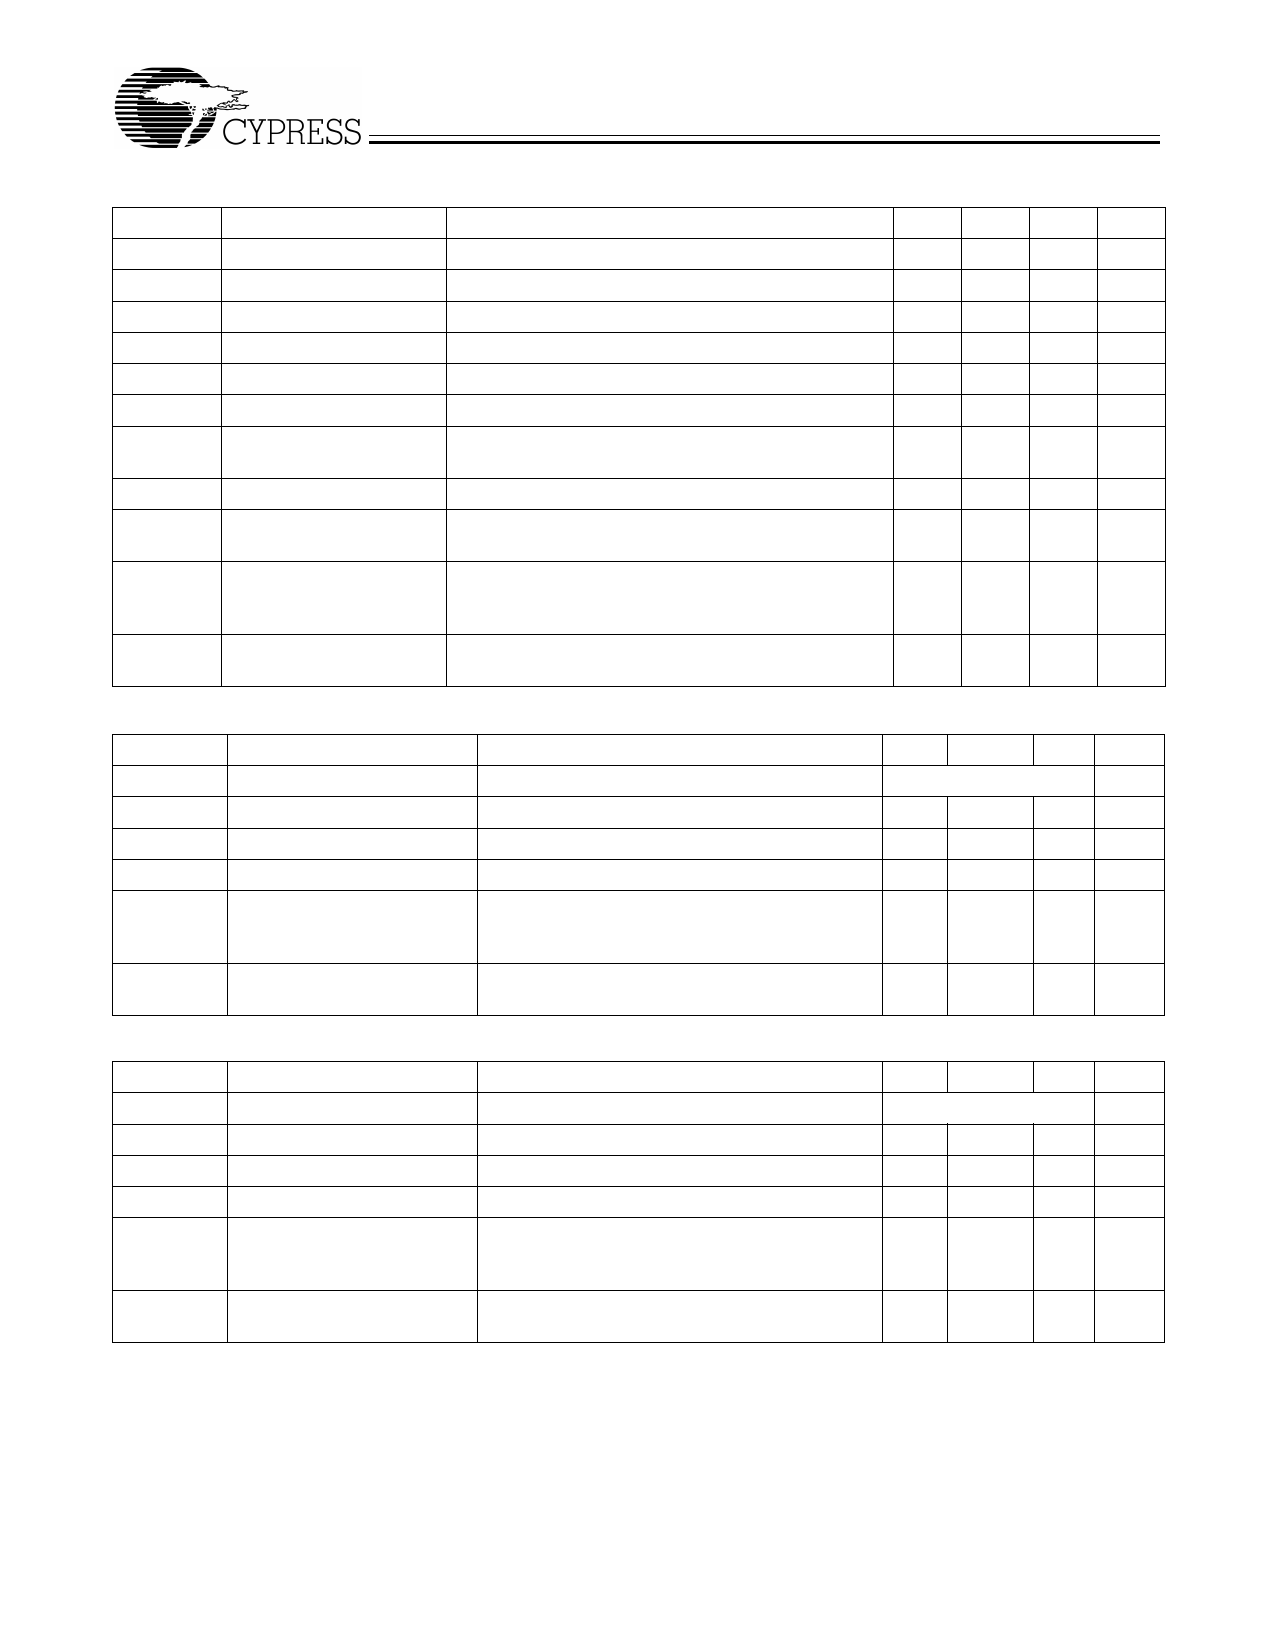
PRELIMINARY
W216
PCI Clock Outputs, PCI0:5 (Lump Capacitance Test Load = 30 pF
Parameter
Description
Test Condition/Comments
tP
Period
Measured on rising edge at 1.5V
tH
High Time
Duration of clock cycle above 2.4V
tL
Low Time
Duration of clock cycle below 0.4V
tR
Output Rise Edge Rate Measured from 0.4V to 2.4V
tF
Output Fall Edge Rate Measured from 2.4V to 0.4V
tD
Duty Cycle
Measured on rising and falling edge at 1.5V
tJC
Jitter, Cycle-to-Cycle
Measured on rising edge at 1.5V. Maximum
difference of cycle time between two adjacent cycles.
tSK
Output Skew
Measured on rising edge at 1.5V
tO
CPU to PCI Clock Skew Covers all CPU/PCI outputs. Measured on rising
edge at 1.5V. CPU leads PCI output.
fST
Frequency Stabilization Assumes full supply voltage reached within 1 ms
from Power-up (cold
from power-up. Short cycles exist prior to frequency
start)
stabilization.
Zo
AC Output Impedance Average value during switching transition. Used for
determining series termination value.
Min.
30
12
12
1
1
45
1.5
Typ.
15
Max.
4
4
55
250
500
4
3
Unit
ns
ns
ns
V/ns
V/ns
%
ps
ps
ns
ms
Ω
IOAPIC0 and IOAPIC_F Clock Outputs (Lump Capacitance Test Load = 20 pF)
Parameter
Description
Test Condition/Comments
f
Frequency, Actual
Frequency generated by crystal oscillator
tR
Output Rise Edge Rate
Measured from 0.4V to 2.0V
tF
Output Fall Edge Rate
Measured from 2.0V to 0.4V
tD
Duty Cycle
Measured on rising and falling edge at 1.25V
fST
Frequency Stabilization from Assumes full supply voltage reached within
Power-up (cold start)
1 ms from power-up. Short cycles exist prior to
frequency stabilization.
Zo
AC Output Impedance
Average value during switching transition. Used
for determining series termination value.
Min.
1
1
45
Typ.
14.318
15
Max.
4
4
55
1.5
Unit
MHz
V/ns
V/ns
%
ms
Ω
REF0:1 Clock Outputs (Lump Capacitance Test Load = 20 pF)
Parameter
Description
Test Condition/Comments
f
Frequency, Actual
Frequency generated by crystal oscillator
tR
Output Rise Edge Rate
Measured from 0.4V to 2.4V
tF
Output Fall Edge Rate
Measured from 2.4V to 0.4V
tD
Duty Cycle
Measured on rising and falling edge at 1.5V
fST
Frequency Stabilization from Assumes full supply voltage reached within
Power-up (cold start)
1 ms from power-up. Short cycles exist prior to
frequency stabilization.
Zo
AC Output Impedance
Average value during switching transition. Used
for determining series termination value.
Min.
0.5
0.5
45
Typ.
14.318
25
Max.
2
2
55
3
Unit
MHz
V/ns
V/ns
%
ms
Ω
11
Share Link: 