W216 Ver la hoja de datos (PDF) - Cypress Semiconductor
Número de pieza
componentes Descripción
Lista de partido
W216 Datasheet PDF : 14 Pages
| |||
PRELIMINARY
W216
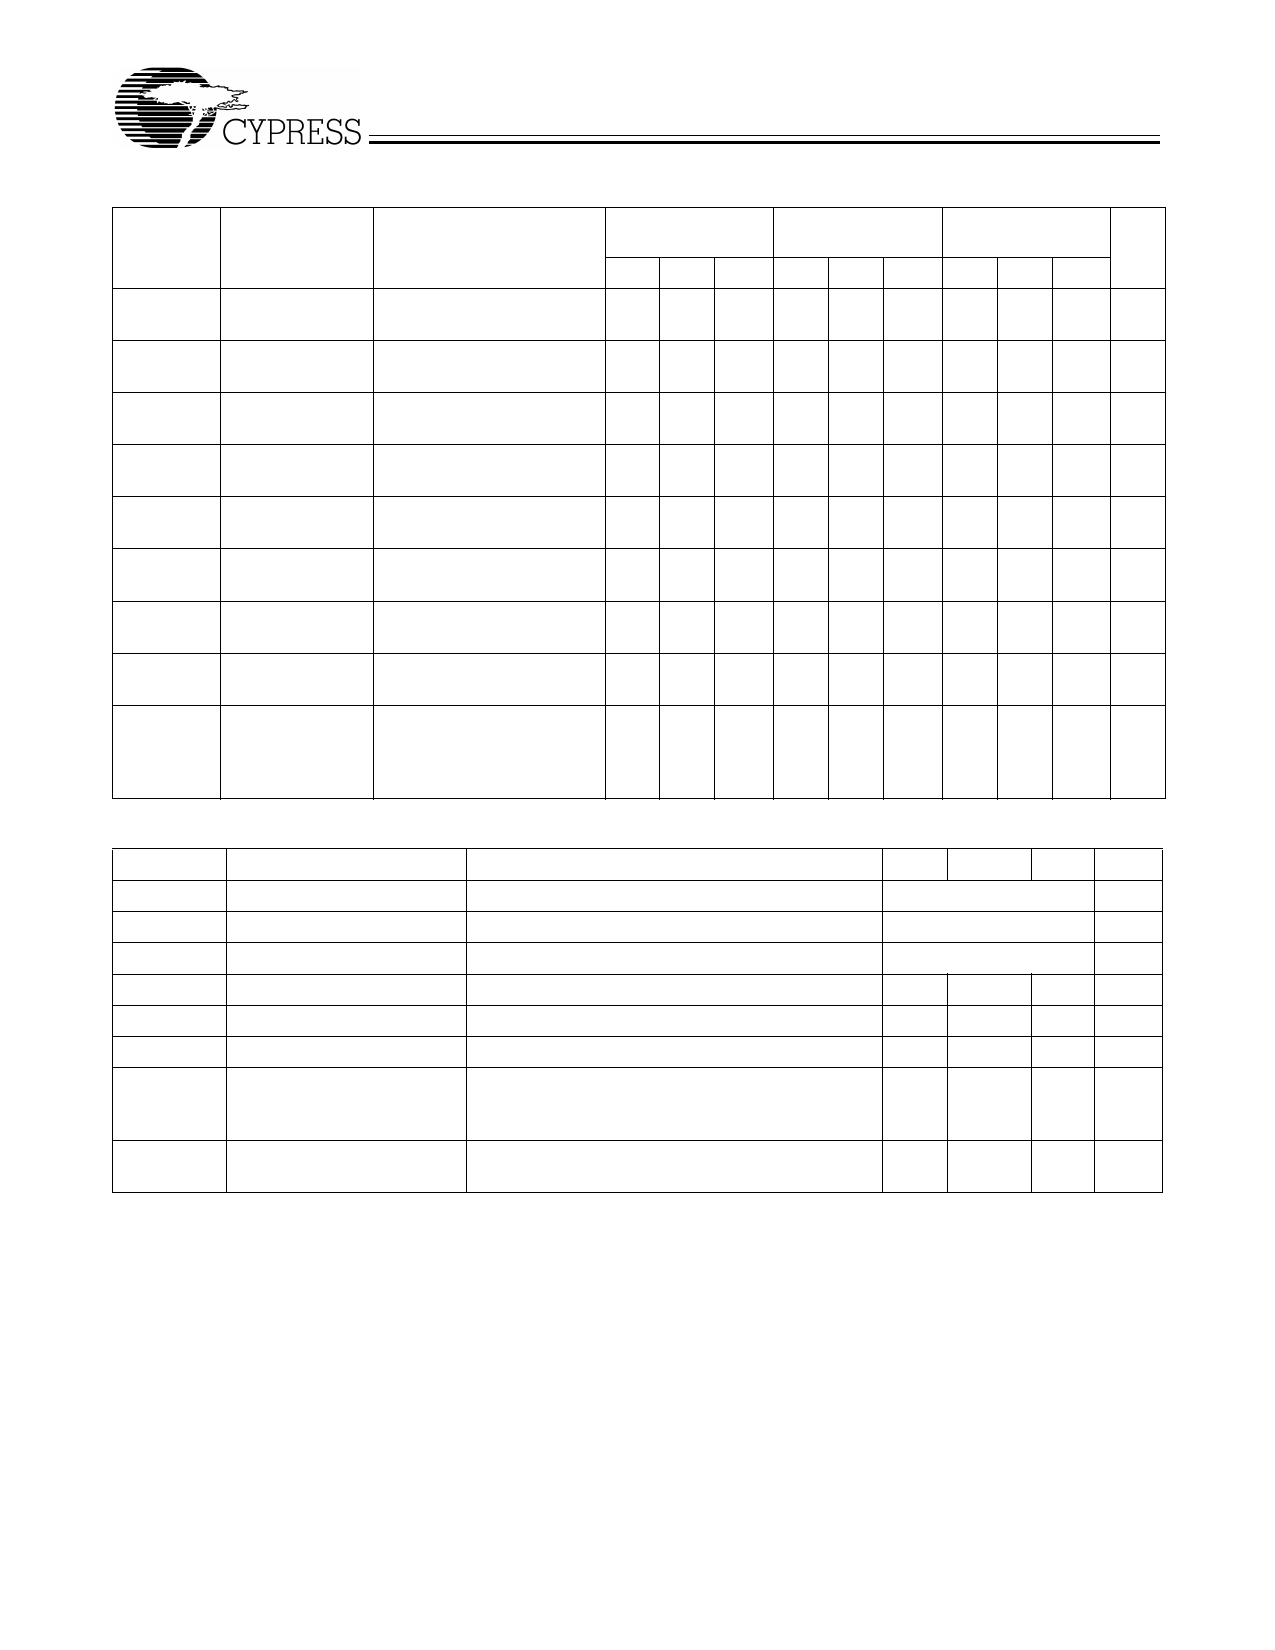
SDRAM 0:15,_F Clock Outputs (Lump Capacitance Test Load = 22 pF)
Parameter Description
Test Condition/
Comments
SDRAMIN =
66.8 MHz
SDRAMIN =
100 MHz
SDRAMIN =
133 MHz
Min. Typ. Max. Min. Typ. Max. Min. Typ. Max. Unit
tP
Period
Measured on rising edge 15
at 1.5V
15.5 10
10.5 7.5
8.0 ns
tH
High Time
Duration of clock cycle
5.2
above 2.4V
3.0
1.87
ns
tL
Low Time
Duration of clock cycle
5.0
below 0.4V
2.0
1.67
ns
tR
Output Rise
Measured from 0.4V to
1
Edge Rate
2.4V
41
41
4 V/ns
tF
Output Fall Edge Measured from 2.4V to
1
Rate
0.4V
41
41
4 V/ns
tD
Duty Cycle
Measured on rising and 45
55 45
55 45
55 %
falling edge at 1.5V
tSK
Output Skew Measured on rising and
falling edge at 1.5V
250
250
250 ps
tPD
Propagation
Measured from SDRAMIN
3.7
3.7
3.7
ns
Delay
Zo
AC Output
Average value during
15
15
15
Ω
Impedance
switching transition. Used
for determining series ter-
mination value.
48-MHz Clock Output (Lump Capacitance Test Load = 20 pF)
Parameter
Description
Test Condition/Comments
f
Frequency, Actual
Determined by PLL divider ratio (see m/n below)
fD
Deviation from 48 MHz
(48.008 – 48)/48
m/n
PLL Ratio
(14.31818 MHz x 57/17 = 48.008 MHz)
tR
Output Rise Edge Rate Measured from 0.4V to 2.4V
tF
Output Fall Edge Rate
Measured from 2.4V to 0.4V
tD
Duty Cycle
Measured on rising and falling edge at 1.5V
fST
Frequency Stabilization Assumes full supply voltage reached within 1 ms
from Power-up (cold start) from power-up. Short cycles exist prior to fre-
quency stabilization.
Zo
AC Output Impedance
Average value during switching transition. Used
for determining series termination value.
Min.
0.5
0.5
45
Typ.
48.008
+167
57/17
25
Max.
2
2
55
3
Unit
MHz
ppm
V/ns
V/ns
%
ms
Ω
12
Share Link: 